The data we analyze come to us by some process we will refer to as the data generating process. The nature of this process has a tremendous impact on what we can learn about reality from these data. Statistical inference is an attempt to logically reverse engineer the data generating process. We start with the data in an attempt to learn about some aspect of reality that generated these data. I am convinced one thing that makes learning statistical inference difficult is the need to think backward about the data-generating process.
4.1 Data Examples
To illustrate the concepts and techniques presented in this chapter will will use a set of hypothetical research projects that aim to predict height of adults. These projects will increase in complexity.
4.1.1 Example 1: How well does Reported Height Predict Measured Height?
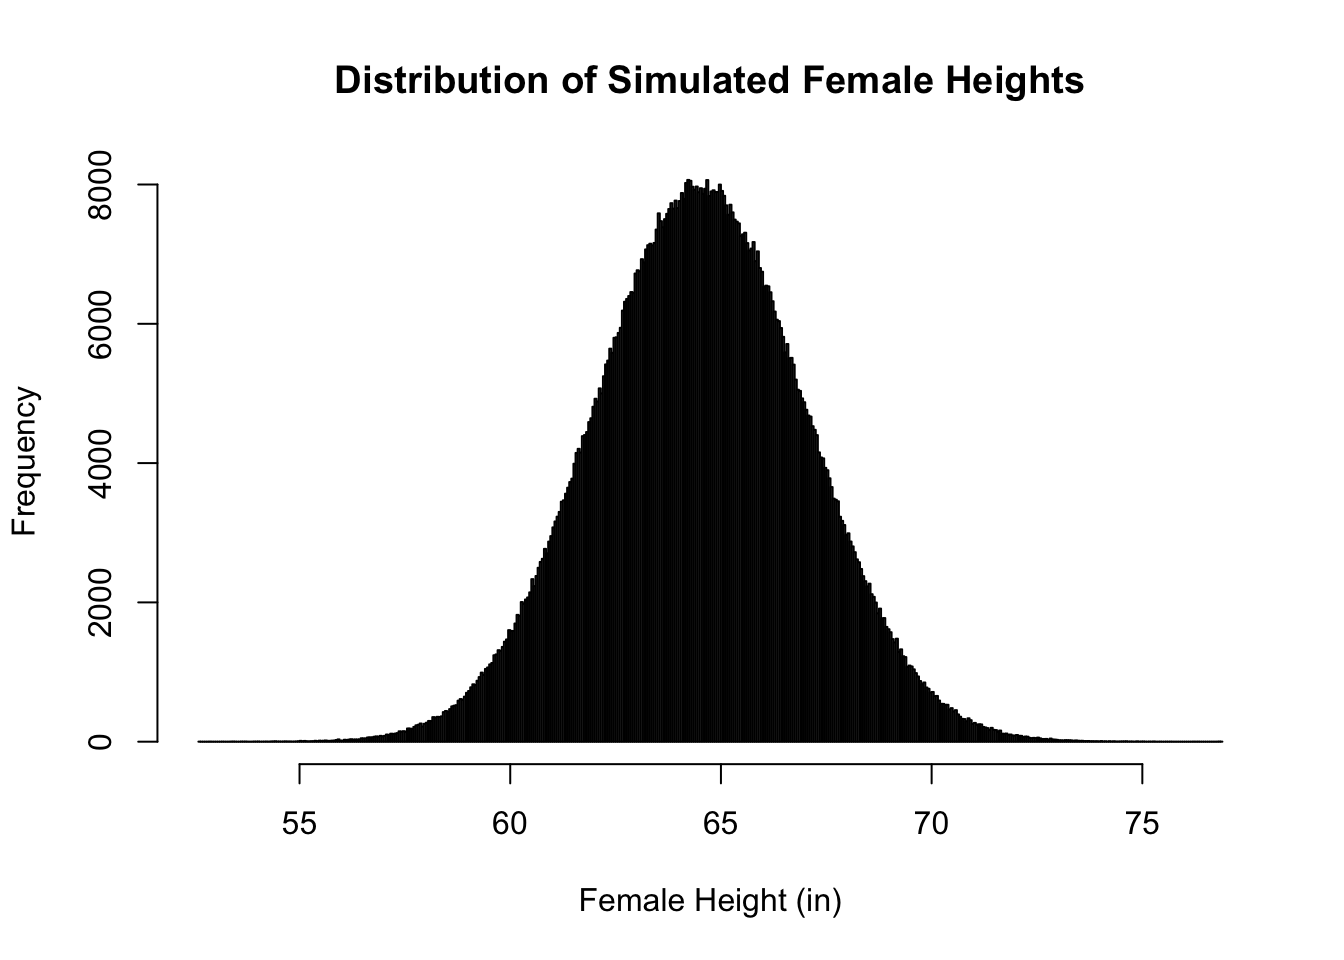
We will assume we know that the average height of an adult female is 5 feet 4.5 inches and the standard deviation is 2.5 inches. So that we are not dealing with two units of measurement, feet and inches, we will convert this to inches, so we have 64.5 inches as the mean height of an adult woman.
# Create objects with the parameters needed for a normal distributionmean_female_height <-64.5sd_female_height <-2.5n_obs <-1e6# Create a vector of simulated female heights using the parameters.female_heights <-rnorm(n = n_obs, mean = mean_female_height, sd = sd_female_height)# Plot the simulated distribution of female heightshist(female_heights, breaks ="fd", # This argument uses the Freedman-Diaconis algorithm # to calculate the number of bins.main ="Distribution of Simulated Female Heights",xlab ="Female Height (in)")